

Prepared Exclusively for Juan Martinez
July 2026

This assignment pairs Los Angeles' most active multifamily investment team with its dominant luxury residential brokerage. The LAAA Team puts Manzanita & Sanborn in front of every active apartment investor in Los Angeles — 1031 exchange buyers, private syndicators, and value-add operators. Carolwood Estates opens a second, entirely separate buyer pool: residential and owner-user buyers who evaluate the triplex and the Silver Lake location on lifestyle value rather than cap rate. Between the two channels, no qualified buyer — commercial or residential — is missed.
Since 2013, the LAAA Team has closed 460+ multifamily transactions totaling $1.47B+ in volume across Los Angeles, Ventura, and Santa Barbara counties. Our practice is built on disciplined underwriting, the deepest comparable-sales dataset in the market, and a marketing engine that reaches every active multifamily buyer in Los Angeles. We advise owners on when and how to sell — not just whether — and we price to clear, not to languish.
For Manzanita & Sanborn, that means an evidence-based opinion of value anchored in recent Silver Lake, East Hollywood, and Echo Park vintage apartment sales — presented with the same rigor we would bring to defending the price against a buyer's due-diligence challenge.


• Chairman's Club — Marcus & Millichap's top-tier annual honor
• National Achievement Award — multiple years, both partners
• #1 Most Active Multifamily Team in LA County — CoStar 2019-2021
• Sales Recognition Award — every year since 2016
• 40+ transactions per year — one of SoCal's most active groups
Founded in 2022 by Drew Fenton, Carolwood Estates has become the defining luxury residential brokerage in Los Angeles — and the second distribution channel for this portfolio. Carolwood's residential network prices assets like the Manzanita triplex the way its buyers do: as scarce, character Silver Lake real estate, not a cap-rate line item.
Carolwood handled six of LA County's nine most expensive sales of 2025 — including both record $110M closings — and is a member of Forbes Global Properties. Nearly a third of its 2025 volume traded off-market through its private-exchange network, the same discreet channel this portfolio will be shown through.

904 Manzanita St and 905 Sanborn Ave are two vintage apartment properties on the same assessor block, held by the same family since 1996 and now coming to market for the first time in a generation. We recommend selling the two parcels individually — each has a distinct highest-and-best buyer, and two separate sales maximize combined proceeds. Both sit one block off Sunset Boulevard at Sunset Junction — the retail and dining heart of Silver Lake.
905 Sanborn is an eight-unit 1927 building of singles and one-bedrooms across two structures, collecting $12,779/month. At $1,600,000 it delivers a 6.7% reassessed cap rate and a 10.4 GRM — yield at the very top of what Silver Lake offers — with the per-unit price still set below the sold-comp median and the needed roof replacement disclosed up front.
904 Manzanita is a 1916 three-unit property of one-bedroom cottage-style units on a 5,643 SF LARD1.5 lot, delivered with two of three units vacant — a rare Silver Lake opportunity for an owner-user or residential buyer, marketed through Carolwood's residential channel in parallel with the investor campaign.
*Combined GSR = Sanborn in-place collections ($153,348/yr) + Manzanita with the two vacant units at market rent ($69,420/yr). See Financial Analysis.
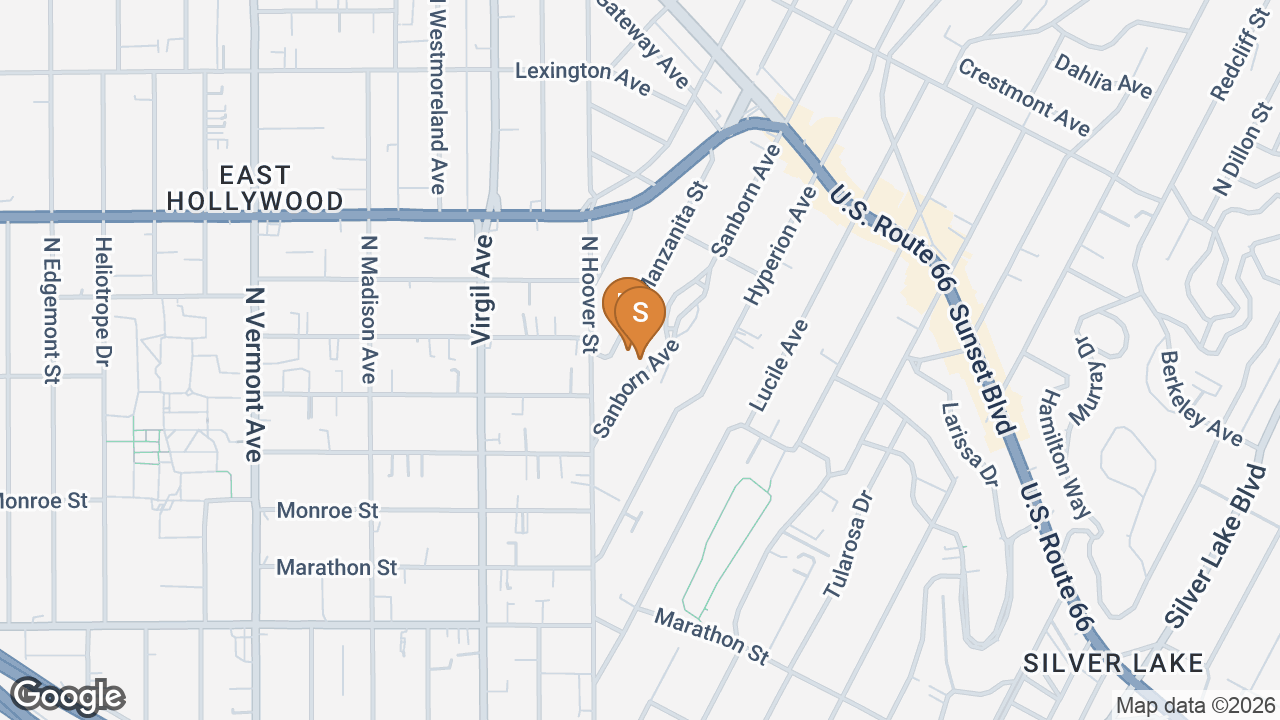
The portfolio sits on the short wedge of blocks where Manzanita Street and Sanborn Avenue meet, one block north of Sunset Boulevard at Sunset Junction — the commercial and cultural core of Silver Lake. Residents walk to Intelligentsia Coffee, Mohawk General Store, the Silver Lake Farmers Market, and the dense restaurant-and-bar corridor along Sunset and Santa Monica Boulevards.
Silver Lake consistently ranks among Los Angeles' tightest rental submarkets: a renter base of creative-industry and tech professionals, a housing stock dominated by exactly this kind of small vintage property, and almost no developable land. One-bedroom units in vintage buildings near the Junction currently ask $2,000–$2,450 per month, and the neighborhood's premium over adjacent East Hollywood continues to widen.
The location also draws on the employment corridors of Hollywood (3 miles west), Downtown LA (4 miles southeast), and the Glendale/Burbank media cluster (via the 2 and 5 freeways). The 101 freeway is under a mile away, and Metro's B Line at Vermont/Santa Monica is a 15-minute walk.
| Location Details | |
|---|---|
| Submarket | Silver Lake (Sunset Junction) |
| ZIP | 90029 |
| Walk To | Sunset Junction retail & dining (1 block) |
| Vintage 1BR Market Rent | $2,000–$2,450/mo |
| Employment Hubs | Hollywood, DTLA, Glendale/Burbank |
| Freeway Access | 101 / 2 / 5 |
| Transit | Metro B Line (Vermont/Santa Monica) |
| Zoning (both parcels) | LARD1.5 |

| Property Overview | |
|---|---|
| Units | 8 — singles & 1BRs (per assessor; roll to be verified) |
| Year Built | 1927 · 2 buildings |
| Building SF | 4,318 |
| APN | 5427-005-022 |
| Lot Size | 5,466 SF (0.13 ac) · 45' × 95' |
| Zoning | LARD1.5 |
| Construction | Wood frame |
| Parking | Street |
| Occupancy | Fully occupied (owner-reported roll) — to be verified |
| Condition | Roof replacement needed (disclosed; reflected in pricing) |
| Regulatory & Utilities | |
|---|---|
| Rent Control | LA RSO (pre-1978 vintage) |
| Owner Pays | Water (DWP), insurance |
| Tenant Pays | Gas, electric |
| Laundry | On premises |
| 2025 Property Taxes | $5,655 (AV $387,671 · 1996 base) |
| Property Overview | |
|---|---|
| Units | 3 × 1BR/1BA (~553 SF avg) |
| Year Built | 1916 · 2 buildings |
| Building SF | 1,659 |
| APN | 5427-005-019 (assessor situs 906 Manzanita) |
| Lot Size | 5,643 SF (0.13 ac) |
| Zoning | LARD1.5 |
| Construction | Wood frame, cottage-style |
| Parking | 1 on-site space + street |
| Occupancy | 1 of 3 occupied — front & back units vacant |
| Condition | Vacant units deliverable at close; interiors to be verified |
| Regulatory & Utilities | |
|---|---|
| Rent Control | LA RSO (pre-1978 vintage) |
| Owner Pays | All utilities on occupied unit (water, gas, electric, trash) |
| Tenant Pays | — (historic all-inclusive structure; new leases can re-set) |
| Laundry | To be verified |
| 2025 Property Taxes | $2,962 (AV $220,915 · 1996 base) |
Parcel data per LA County Assessor. The Manzanita parcel's assessor situs address is 906 Manzanita St; the building carries unit addresses including 904. The Sanborn building carries addresses 905 and 907. Buyer to verify all specifications in due diligence.
1031 Exchange Buyers
Yield-driven exchangers who cannot find a 7%+ reassessed cap anywhere in Silver Lake. The Sanborn 8-unit at 9.8 GRM is the strongest income print in the submarket's active inventory.
Private Local Investors / Value-Add Operators
Operators who understand vintage RSO product and want the Manzanita vacancy as immediate mark-to-market plus the long-term optionality of two adjacent LARD1.5 parcels.
Owner-Users & Residential Buyers (Carolwood channel)
Buyers who want to live in one of the vacant Manzanita cottage units and let the remaining income carry the property — a lifestyle purchase priced against Silver Lake residential values, not cap rates.
First-Time Multifamily Buyers
The triplex at $900,000 is an accessible Silver Lake entry point with residential-style financing available and two units deliverable vacant.
Selling the parcels individually — each marketed through the channel its buyer actually shops in — widens the buyer pool well beyond a typical single-channel RSO listing.
"The 8-unit needs a new roof."
Disclosed up front and reflected in the pricing: $200,000/unit is roughly 15% below the $235,807 sold-comp median, and the 6.69% reassessed cap out-yields the nearly identical 8-unit comp at 4563 W Fountain Ave (6.20%, closed July 2025). The yield premium over the comp set is the buyer's roof budget.
"These are RSO buildings with below-market rents."
Sanborn's $1,597/unit average is close to market for vintage singles/1BRs in this pocket — this is not a deep-RSO-discount roll. At Manzanita, two of three units are vacant and re-lease immediately at market (~$2,095); only one legacy tenancy remains.
"There's no per-unit rent roll for Sanborn."
The aggregate collections ($12,779/mo) reconcile with the owner's 2025 reported income of $168,401 across both properties. The certified per-unit roll is delivered in due diligence, and the underwriting uses only the verified aggregate.
"Why is the triplex priced at a 5.3% cap?"
Because its buyer isn't buying a cap rate. Two of three units vacant on a 5,643 SF Silver Lake lot prices against the residential market — and at $900,000 the ask sits well below Redfin's automated estimate of ~$1.06M. That is exactly why Carolwood is on the listing; the income lens is the floor, not the value.

| Address | Submarket | Yr | Units | Sale Price | $/Unit | $/SF | Cap | Dist | Sold |
|---|---|---|---|---|---|---|---|---|---|
| 4563 W Fountain Ave · source ↗ | East Hollywood | 1923 | 8 | $1,550,000 | $193,750 | $279 | 6.20% | ≈0.7 mi | Jul 2025 |
| 763 N Heliotrope Dr · source ↗ | East Hollywood | 1922 | 4 | $950,000 | $237,500 | $238 | — | ≈0.9 mi | Sep 2025 |
| 101 S Kenmore Ave · source ↗ | E Hollywood / Ktown | 1925 | 8 | $1,595,000 | $199,375 | $204 | 7.00% | ≈1.6 mi | Jul 2025 |
| 2050 N Commonwealth Ave · source ↗ | Los Feliz | 1928 | 17 | $4,700,000 | $276,471 | $384 | — | ≈1.3 mi | Aug 2025 |
| 5405-5419 Fernwood Ave · source ↗ | East Hollywood | 1939 | 28 | $6,555,175 | $234,113 | $227 | 6.29% | ≈1.5 mi | Apr 2025 |
| 624 Silver Lake Blvd · source ↗ | Silver Lake | — | 4 | $1,315,000 | $328,750 | $412 | — | ≈1.4 mi | Jan 2025 |
| Median (6 sold comps) | $1,572,500 | $235,807 | $259 | 6.29% | - | - | |||
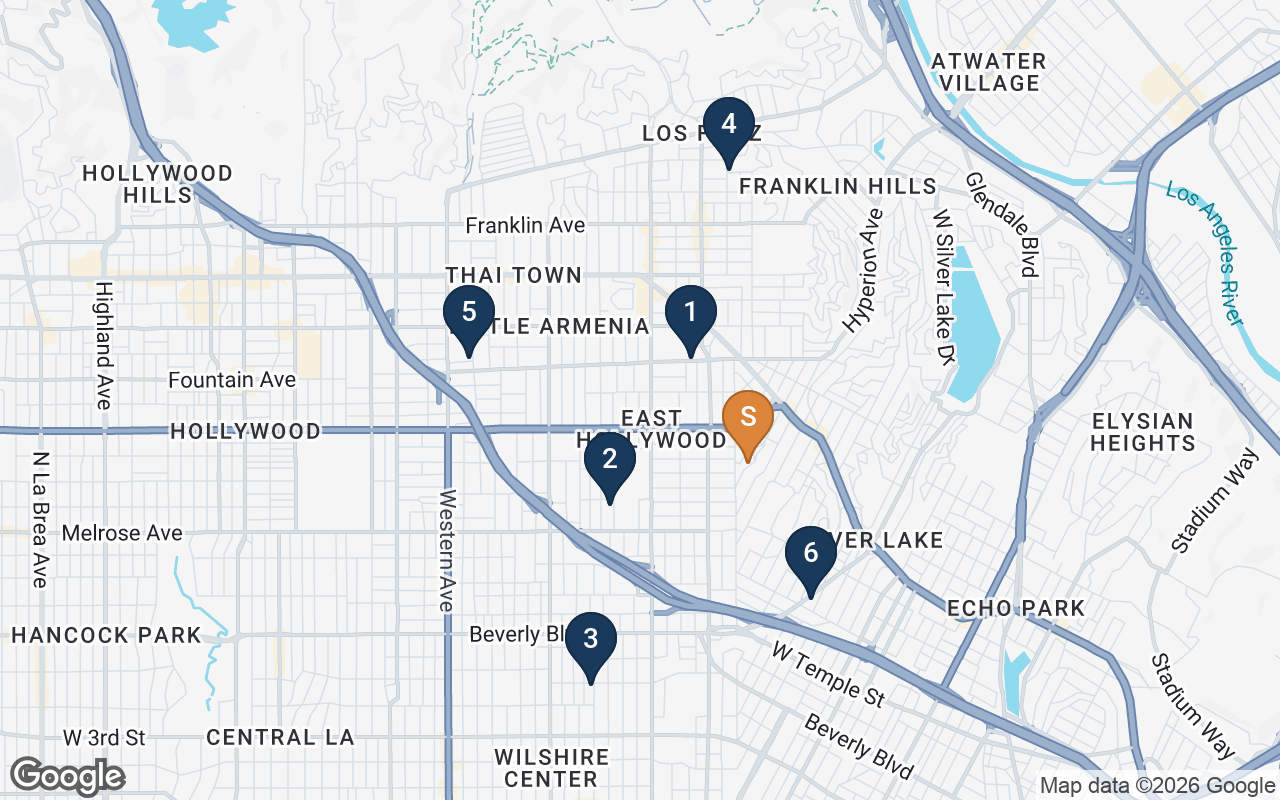
1. 4563 W Fountain Ave — The controlling comp for Sanborn: an eight-unit 1923 vintage building in the adjacent East Hollywood pocket, closed July 2025 at $1,550,000 ($193,750/unit, 6.20% cap, 11.26 GRM). Sanborn is priced within 3% of this print at $1,600,000 — with a superior Silver Lake location — while still delivering a higher cap rate (6.69%) and a lower GRM (10.43).
2. 763 N Heliotrope Dr — An original-condition 1922 fourplex of one-bedrooms that closed at $950,000 ($237,500/unit). The closest size analog for the Manzanita triplex: it shows vintage small-unit product clearing near $240K/unit even without vacancy — Manzanita's premium reflects its two deliverable-vacant units and residential-channel appeal.
3. 101 S Kenmore Ave — An eight-unit 1925 building that traded at a 7.00% cap and 9.65 GRM — the value-priced end of the vintage band. Sanborn's 6.69% reassessed cap approaches this yield tier while carrying a far stronger Silver Lake location.
4. 2050 N Commonwealth Ave — "The Berkshire," a 17-unit 1928 Los Feliz building and another first-sale-in-a-generation offering, closed at $276,471/unit and $384/SF. Demonstrates what scale-plus-character vintage product commands just north of the subject.
5. 5405-5419 Fernwood Ave — A 28-unit 1939 East Hollywood property at $234,113/unit and a 6.29% cap — the mid-market institutional print that anchors the comp-set median.
6. 624 Silver Lake Blvd — A four-unit Silver Lake building delivered with three of four units vacant, closed at $1,315,000 ($412/SF). The direct precedent for pricing vacancy as an asset in this neighborhood — the same dynamic that drives the Manzanita triplex's residential-lens value.

| Address | Submarket | Yr | Units | List Price | $/Unit | $/SF | Cap | Status |
|---|---|---|---|---|---|---|---|---|
| 1180 Myra Ave | Silver Lake | 1923 | 4 | $1,695,000 | $423,750 | $511 | 4.24% | Active · ≈49 DOM |
| 1217 Westerly Ter | Silver Lake | 1967 | 4 | $1,595,000 | $398,750 | $394 | 5.90% | Active · ≈27 DOM |
| 931 Everett St | Echo Park | 1917 | 5 | $1,875,000 | $375,000 | $383 | 6.83% | Active · ≈69 DOM |
| 1250 N Mariposa Ave | East Hollywood | 1930 | 7 | $2,400,000 | $342,857 | $184 | 6.29% | Active · ≈76 DOM |
| 405 Coronado Ter | Echo Park | 1935 | 8 | $1,575,000 | $196,875 | $276 | 5.01% | Active · ≈128 DOM |
| 1727 Bellevue Ave | Echo Park | 1917 | 6 | $1,499,888 | $249,981 | $449 | — | Active · ≈249 DOM |
| Average (6 active comps) | $1,773,315 | $331,202 | $366 | - | - | |||
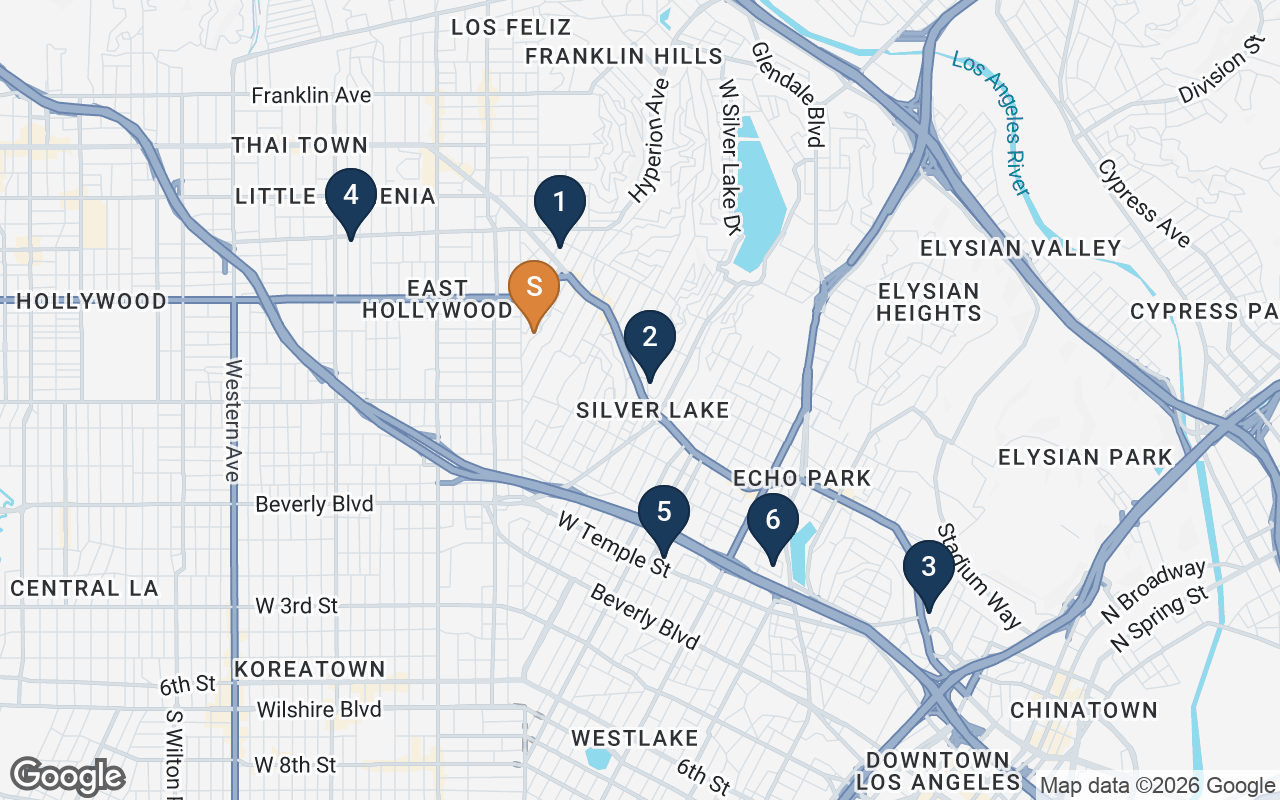
The active set frames both sides of the pricing argument. On the yield side, no active listing in the Silver Lake / Echo Park / East Hollywood pocket offers a cap rate above 6.83% — Sanborn's 6.69% reassessed cap at $1,600,000 sits at the very top of the active-yield band, and the 8-unit at 405 Coronado Ter (asking $196,875/unit at a 5.01% cap, sitting 128 days) shows that Sanborn's per-unit basis is at the market-clearing level while its yield is dramatically stronger. On the residential-value side, the 1923 fourplex at 1180 Myra Ave — two blocks from the subject — asks $423,750/unit, roughly 41% above Manzanita's $300,000/unit, on a building with no vacancy story and no owner-user angle. The cautionary tale is 1727 Bellevue at 249 days on market: aspirational pricing without a story sits. Each of these two sales is priced to clear through its own channel.
| 2025 Actuals (Owner-Reported) | 905 Sanborn | 904 Manzanita | Combined |
|---|---|---|---|
| Apartment Income [a] | $153,348 | $15,053 | $168,401 |
| Insurance [b] | ($6,205) | ($2,385) | ($8,590) |
| LADWP (Water & Power) [c] | ($3,063) | ($1,148) | ($4,211) |
| SoCal Gas [d] | — | ($618) | ($618) |
| Property Taxes [d] | ($5,655) | ($2,962) | ($8,617) |
| Plumbing, Repairs, Etc. [c] | ($5,818) | ($2,182) | ($8,000) |
| Supplies & Other [c] | ($1,818) | ($682) | ($2,500) |
| Net (Owner Basis, Pre-Reassessment) | $130,789 | $5,076 | $135,865 |
[a] Owner reported combined 2025 income of $168,401. Sanborn shown at its current in-place roll ($12,779/mo × 12); Manzanita is the remainder, reflecting the vacancy at that property during 2025. [b] Combined premium allocated by building SF (72% / 28%). [c] Combined amount allocated by unit count (8/11 vs 3/11); owner notes repairs and supplies vary year to year. [d] As stated per property on the owner's 2025 summary.
| Building | Mix | Bldg SF | In-Place Rent/Mo | Avg/Unit | Rent/SF | Status |
|---|---|---|---|---|---|---|
| 905 Sanborn Ave (8 units, 2 bldgs) | Singles & 1BR/1BA [1] | 4,318 | $12,779 | $1,597 | $2.96 | Occupied |
| Total | 8 units | 4,318 | $12,779/mo | $1,597 | $2.96 | $153,348/yr GSR |
| Income | Annual | Per Unit | $/SF | % EGI |
|---|---|---|---|---|
| Gross Scheduled Rent [1] | $153,348 | $19,169 | $35.51 | - |
| Less: Economic Vacancy (3%) | ($4,600) | ($575) | ($1.07) | - |
| Effective Gross Income | $148,748 | $18,594 | $34.45 | 100% |
| Expenses | Annual | Per Unit | $/SF | % EGI |
|---|---|---|---|---|
| Real Estate Taxes [2] | $20,000 | $2,500 | $4.63 | 13.4% |
| Insurance [3] | $6,205 | $776 | $1.44 | 4.2% |
| Water / Sewer (DWP) [4] | $3,100 | $388 | $0.72 | 2.1% |
| Trash, Gas, Electric [5] | $1,200 | $150 | $0.28 | 0.8% |
| Repairs & Maintenance [6] | $8,000 | $1,000 | $1.85 | 5.4% |
| Contract Services [7] | $1,200 | $150 | $0.28 | 0.8% |
| Reserves [8] | $2,000 | $250 | $0.46 | 1.3% |
| Total Operating Expenses | $41,705 | $5,213 | $9.66 | 28.0% |
| Net Operating Income | $107,043 | $13,380 | $24.79 | 72.0% |
[1] GSR: Owner-reported in-place collections of $12,779/mo. Assessor records show 4 bedrooms / 8 baths across 8 units — a singles-and-one-bedrooms building; the certified per-unit roll is delivered in due diligence. The $1,597 average is consistent with the building's unit sizes (540 SF avg).
[2] Real Estate Taxes: LA County reassesses to the purchase price at close. Shown at 1.25% of the $1,600,000 list price (current bill: $5,655 on a 1996 base).
[3] Insurance: The owner's actual 2025 combined premium ($8,590) allocated by building SF.
[4] Water / Sewer: The owner's actual 2025 LADWP charge allocated by unit count.
[5] Trash, Gas, Electric: Tenants pay gas and electric. Allowance for common-area service; owner's 2025 statement shows no separate trash line — buyer to verify hauling arrangement.
[6] Repairs & Maintenance: $1,000/unit vintage-building tier — above the owner's allocated 2025 actuals ($7,636 including supplies).
[7] Contract Services: Pest and periodic services allowance.
[8] Reserves: $250/unit for a 1927 building. The roof replacement is treated as a capital (price) item, not an operating expense.
| Unit | Type | ≈SF | Rent/Mo | Rent/SF | Status | Notes |
|---|---|---|---|---|---|---|
| Middle unit | 1BR / 1BA | 553 | $1,595 | $2.88 | Occupied | Long-term tenancy; rent unchanged since 2018 |
| Front unit | 1BR / 1BA | 553 | $2,095 [1] | $3.79 | Vacant | Underwritten at market; deliverable at close |
| Back unit | 1BR / 1BA | 553 | $2,095 [1] | $3.79 | Vacant | Underwritten at market; deliverable at close |
| Total | 3 units | 1,659 | $5,785/mo | $3.49 | 33% occ. | $69,420/yr market GSR |
| Income | Annual | Per Unit | $/SF | % EGI |
|---|---|---|---|---|
| Gross Scheduled Rent (Market) [1] | $69,420 | $23,140 | $41.84 | - |
| Less: Economic Vacancy (3%) | ($2,083) | ($694) | ($1.26) | - |
| Effective Gross Income | $67,337 | $22,446 | $40.59 | 100% |
| Expenses | Annual | Per Unit | $/SF | % EGI |
|---|---|---|---|---|
| Real Estate Taxes [2] | $11,250 | $3,750 | $6.78 | 16.7% |
| Insurance [3] | $2,385 | $795 | $1.44 | 3.5% |
| Water / Sewer (DWP) [4] | $1,200 | $400 | $0.72 | 1.8% |
| Trash, Gas, Electric [5] | $900 | $300 | $0.54 | 1.3% |
| Repairs & Maintenance [6] | $3,000 | $1,000 | $1.81 | 4.5% |
| Contract Services [7] | $600 | $200 | $0.36 | 0.9% |
| Reserves [8] | $750 | $250 | $0.45 | 1.1% |
| Total Operating Expenses | $20,085 | $6,695 | $12.11 | 29.8% |
| Net Operating Income | $47,252 | $15,751 | $28.48 | 70.2% |
[1] GSR: The occupied middle unit at its actual $1,595 rent; the two vacant units underwritten at $2,095/mo — the conservative middle of the verified $2,000–$2,450 asking range for vintage Silver Lake one-bedrooms (Zumper/RentCafe surveys and live listings, July 2026). In-place collections today are $1,595/mo.
[2] Real Estate Taxes: 1.25% of the $900,000 list price on reassessment (current bill: $2,962 on a 1996 base).
[3] Insurance: Owner's actual 2025 combined premium allocated by building SF.
[4] Water / Sewer: Owner's actual 2025 LADWP charge allocated by unit count.
[5] Trash, Gas, Electric: Includes the owner's actual $618 gas. Historic leases were all-utilities-included; new market leases on the vacant units can shift utilities to tenants.
[6] Repairs & Maintenance: $1,000/unit vintage tier, consistent with the owner's allocated actuals.
[7] Contract Services: Pest / periodic services allowance.
[8] Reserves: $250/unit for a 1916 building.
The income statement is the floor value. With two of three units vacant on a 5,643 SF LARD1.5 lot one block from Sunset Junction, the property's clearing price is set by the residential and owner-user market — the Carolwood channel.
| Operating Data | |
|---|---|
| Price | $1,600,000 |
| Down Payment (40%) | $640,000 |
| Number of Units | 8 |
| Price / Unit | $200,000 |
| Price / SF | $371 |
| Gross SF | 4,318 |
| Lot SF | 5,466 |
| Year Built | 1927 |
| Returns (Reassessed) | |
|---|---|
| Cap Rate | 6.69% |
| GRM | 10.43 |
| Cash-on-Cash | 5.93% |
| DSCR | 1.55x |
| Financing (Illustrative) | |
|---|---|
| Loan Amount | $960,000 |
| Rate / Amort | 6.00% / 30yr |
| Loan Constant | 7.20% |
| LTV (actual) | 60.0% |
| Constraint | LTV |
| Income | |
|---|---|
| Gross Scheduled Rent | $153,348 |
| Less Vacancy (3%) | ($4,600) |
| Effective Gross Income | $148,748 |
| Operating Expenses | ($41,705) |
| Net Operating Income | $107,043 |
| Cash Flow | |
|---|---|
| Net Operating Income | $107,043 |
| Debt Service | ($69,072) |
| Net Cash Flow | $37,971 |
| Cash-on-Cash | 5.93% |
| + Principal Reduction (Yr 1) | $11,793 |
| Total Return | 7.78% |
| Expense Ratio | |
|---|---|
| OpEx / EGI | 28.0% |
| OpEx / Unit | $5,213 |
| OpEx / SF | $9.66 |
| Operating Data | |
|---|---|
| Price | $900,000 |
| Down Payment (40%) | $360,000 |
| Number of Units | 3 |
| Price / Unit | $300,000 |
| Price / SF | $542 |
| Gross SF | 1,659 |
| Lot SF | 5,643 |
| Year Built | 1916 |
| Returns (Reassessed, Market Rents) | |
|---|---|
| Cap Rate | 5.25% |
| GRM | 12.96 |
| Cash-on-Cash | 2.33% |
| DSCR | 1.22x |
| Financing (Illustrative) | |
|---|---|
| Loan Amount | $540,000 |
| Rate / Amort | 6.00% / 30yr |
| Loan Constant | 7.20% |
| LTV (actual) | 60.0% |
| Constraint | LTV |
| Income (Market Rents on Vacants) | |
|---|---|
| Gross Scheduled Rent | $69,420 |
| Less Vacancy (3%) | ($2,083) |
| Effective Gross Income | $67,337 |
| Operating Expenses | ($20,085) |
| Net Operating Income | $47,252 |
| Cash Flow | |
|---|---|
| Net Operating Income | $47,252 |
| Debt Service | ($38,853) |
| Net Cash Flow | $8,399 |
| Cash-on-Cash | 2.33% |
| + Principal Reduction (Yr 1) | $6,633 |
| Total Return | 4.18% |
| Expense Ratio | |
|---|---|
| OpEx / EGI | 29.8% |
| OpEx / Unit | $6,695 |
| OpEx / SF | $12.11 |
We recommend bringing the properties to market as two separate listings, each priced to its own buyer pool: the Sanborn 8-unit to yield-driven apartment investors, the Manzanita triplex to residential, owner-user, and first-time buyers through the Carolwood channel. A buyer who wants both can still acquire the pair.
| Purchase Price | Cap Rate | Cash-on-Cash | $/Unit | $/SF | GRM | DSCR |
|---|---|---|---|---|---|---|
| $1,750,000 | 6.01% | 4.23% | $218,750 | $405 | 11.41 | 1.39x |
| $1,700,000 | 6.22% | 4.77% | $212,500 | $394 | 11.09 | 1.44x |
| $1,650,000 | 6.45% | 5.33% | $206,250 | $382 | 10.76 | 1.49x |
| $1,600,000 | 6.69% | 5.93% | $200,000 | $371 | 10.43 | 1.55x |
| $1,550,000 | 6.95% | 6.57% | $193,750 | $359 | 10.11 | 1.61x |
| $1,500,000 | 7.22% | 7.26% | $187,500 | $347 | 9.78 | 1.67x |
| $1,450,000 | 7.51% | 7.99% | $181,250 | $336 | 9.46 | 1.74x |
| Purchase Price | Cap Rate | Cash-on-Cash | $/Unit | $/SF | GRM | DSCR |
|---|---|---|---|---|---|---|
| $1,000,000 | 4.60% | 1.64% | $333,333 | $603 | 14.40 | 1.20x |
| $950,000 | 4.91% | 1.90% | $316,667 | $573 | 13.68 | 1.20x |
| $900,000 | 5.25% | 2.33% | $300,000 | $542 | 12.96 | 1.22x |
| $850,000 | 5.63% | 3.29% | $283,333 | $512 | 12.24 | 1.30x |
| $800,000 | 6.06% | 4.36% | $266,667 | $482 | 11.52 | 1.40x |
Each matrix holds that property's income and non-tax expenses constant; only reassessed taxes (1.25% of price) move with price. Financing illustrative at 6.00% / 30-year amortization, lesser of 60% LTV or 1.20x DCR — the Manzanita loan turns DCR-constrained at the higher price points, which is typical for a residential-lens asset.
The recommended pricing reconciles three independent lenses, applied property by property. On yield: Sanborn's 6.69% reassessed cap and 10.43 GRM sit inside the closed-comp cap band (6.20–7.00%) and at the very top of the active-listing yield range — the direct answer to the roof condition. On per-unit basis: Sanborn's $200,000/unit is ~15% below the $235,807 sold-comp median and in line with the two vintage 8-unit prints ($193,750 and $199,375/unit), while Manzanita's $300,000/unit sits below the vacancy-rich precedent (624 Silver Lake Blvd, 3-of-4 vacant, $328,750/unit) and far below 1180 Myra Ave asking $423,750/unit two blocks away. On the residential lens: Manzanita's two deliverable-vacant cottages on a 5,643 SF lot price against Silver Lake's residential market (Redfin AVM ≈ $1.06M), which the Carolwood channel is built to capture.
Sold individually as recommended, combined proceeds at list total $2,500,000 — a 6.17% blended reassessed cap and an 11.22 GRM — and each property is positioned to clear on its own within an industry-standard 60–90 day marketing window.